Reports and Insights
The Reporting & Insights module, available from the left-hand sidebar (LHS), provides powerful tools for analysing asset data and generating meaningful reports.
It contains two main sections: Insights and Reports.
Table of Contents
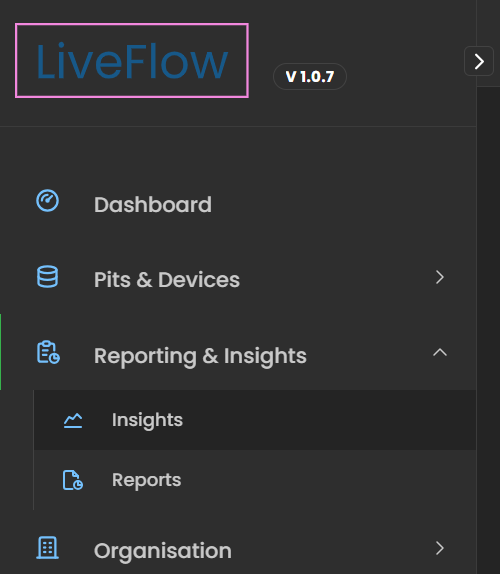
Insights
The Insights section provides a high-level view of asset performance across your organisation. It is available under Reporting & Insights > Insights in the left-hand sidebar.
- Visual Dashboards – Charts and graphs display trends such as fill levels, debris build-up, and device activity.
- Real-Time + Historical Data – Compare current conditions with long-term performance trends.
- Decision Support – Identify recurring issues, high-risk assets, or areas needing extra maintenance attention.
High Risk Assets
The High Risk Assets panel highlights assets that require urgent attention.
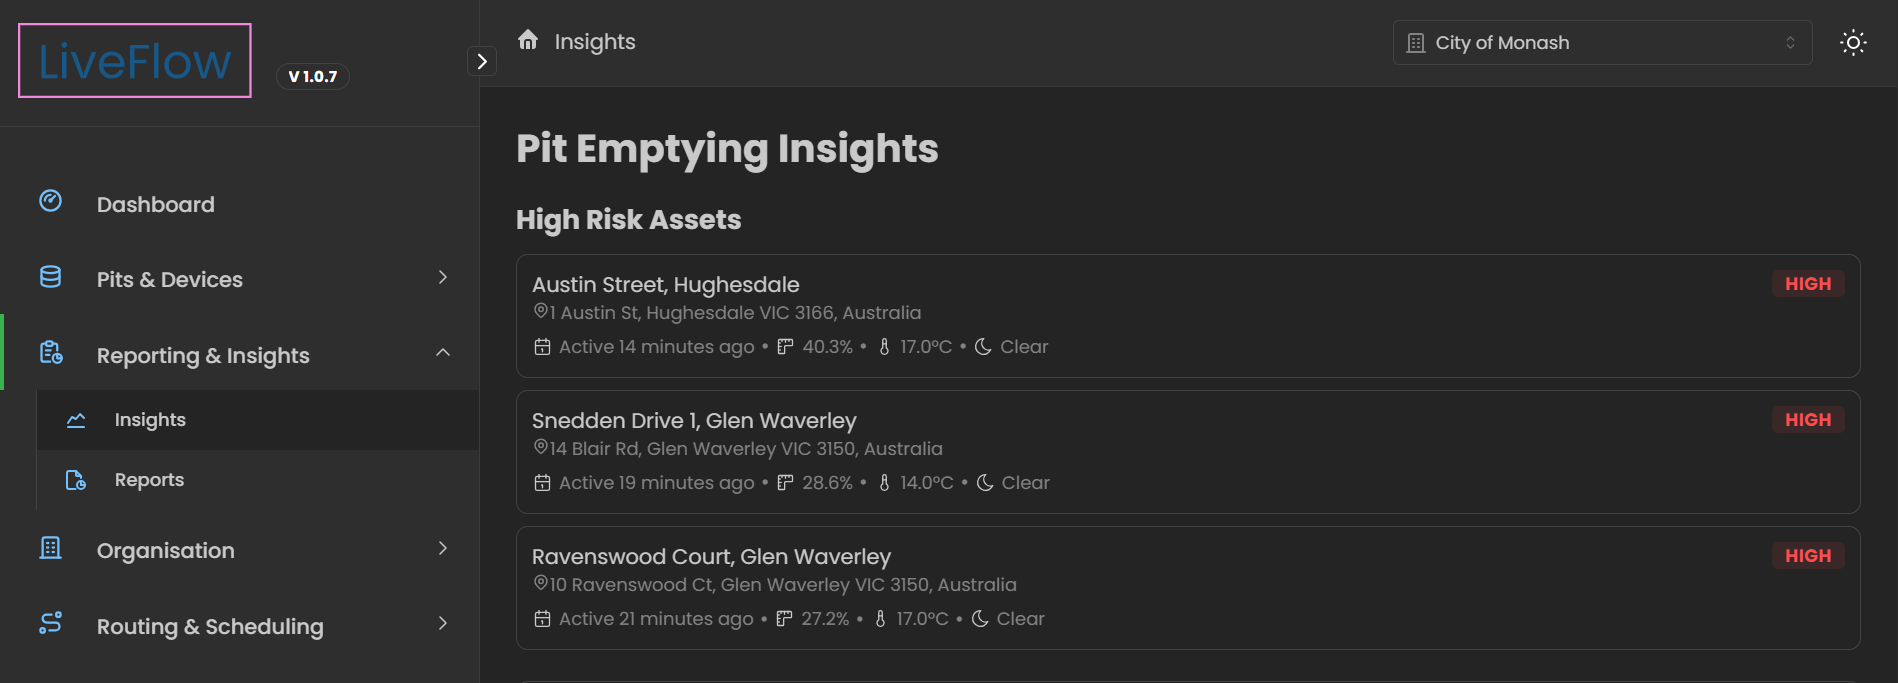
- Priority View – Assets flagged as High appear at the top for immediate focus.
- Details Displayed – Each record shows asset name, address, last active time, fill %, temperature, and weather conditions.
- Actionable Alerts – Use this panel to prioritise inspections and schedule maintenance where risk is greatest.
Debris Heatmap
The Debris Heatmap visualises debris build-up across multiple assets.
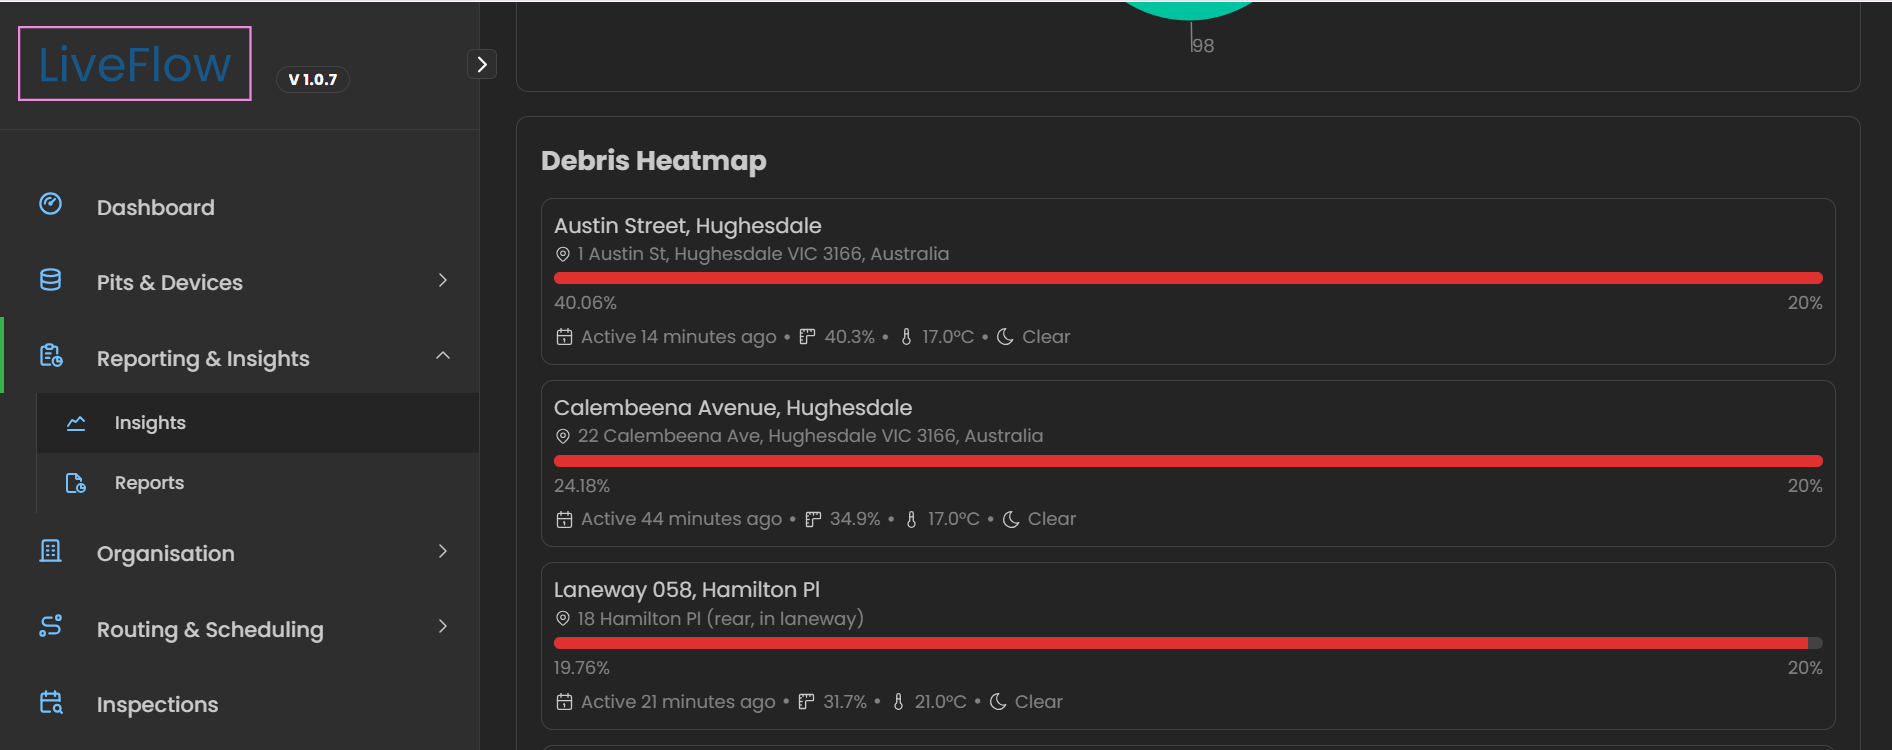
- Visual Indicators – Assets are listed with a percentage fill of debris represented by progress bars.
- Location Context – Each record includes address, active time, debris % and temperature.
- Comparisons – Operators can spot which areas have the heaviest debris accumulation and plan cleaning or inspections accordingly.
Asset Level History
The Asset Level History graph allows you to track changes in asset performance over time.
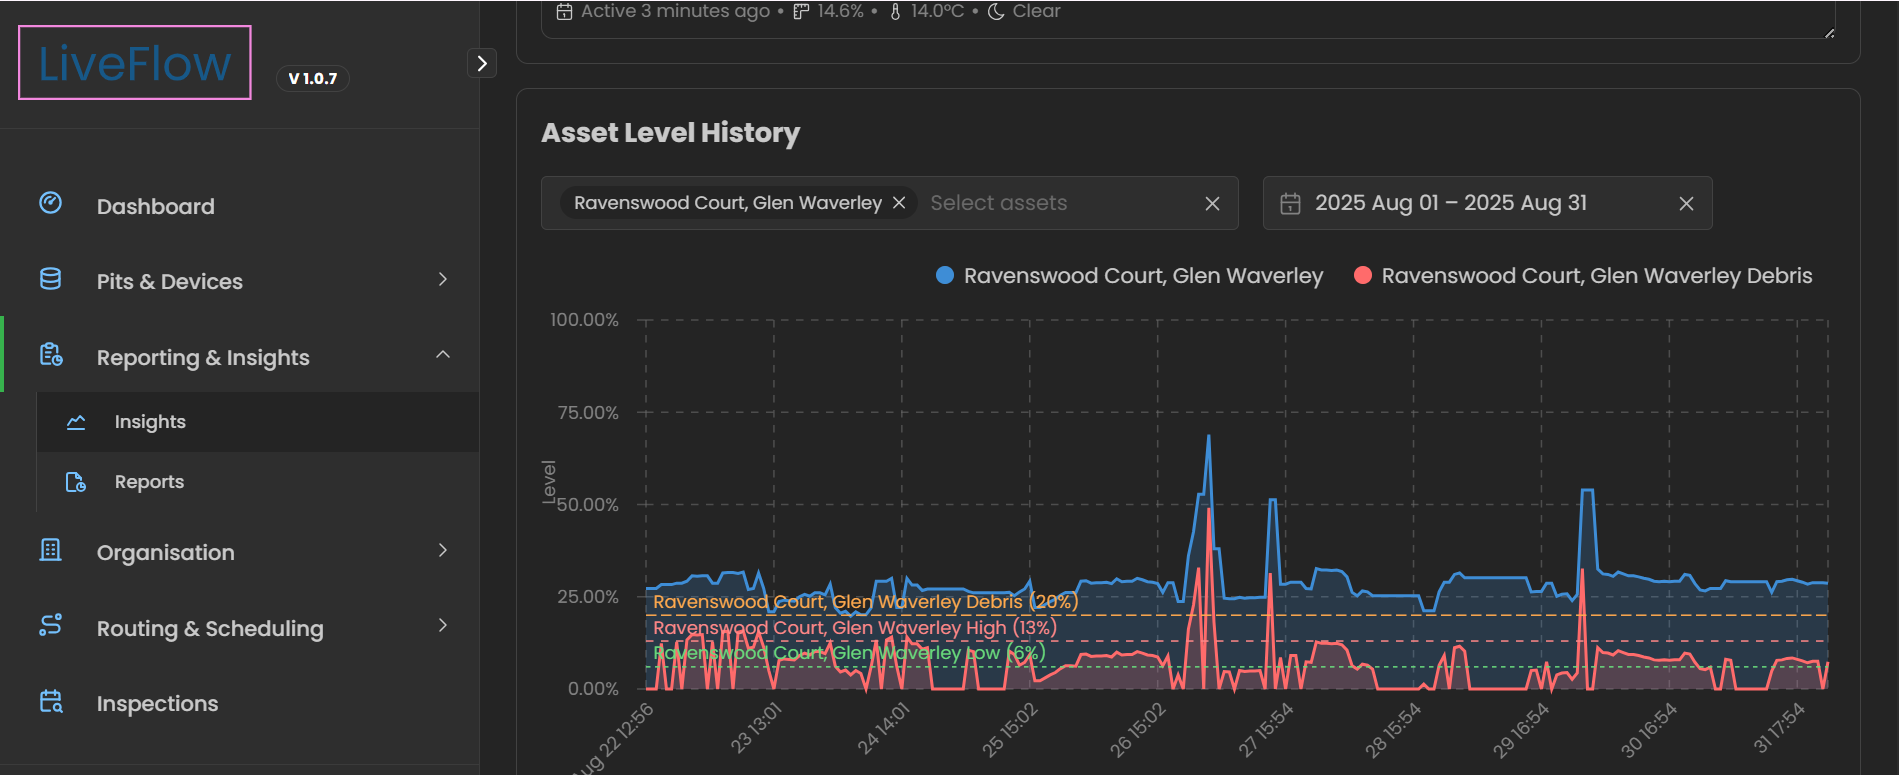
- Customisable View – Select one or more assets to compare trends.
- Date Range Filter – Adjust the timeline to review specific periods of activity.
- Data Tracked – Displays metrics such as fill %, debris levels and thresholds.
- Trend Insights – Helps identify recurring patterns, troughs, spikes, trends and performance.
Reports
The Reports section allows you to generate, view, and export structured reports.
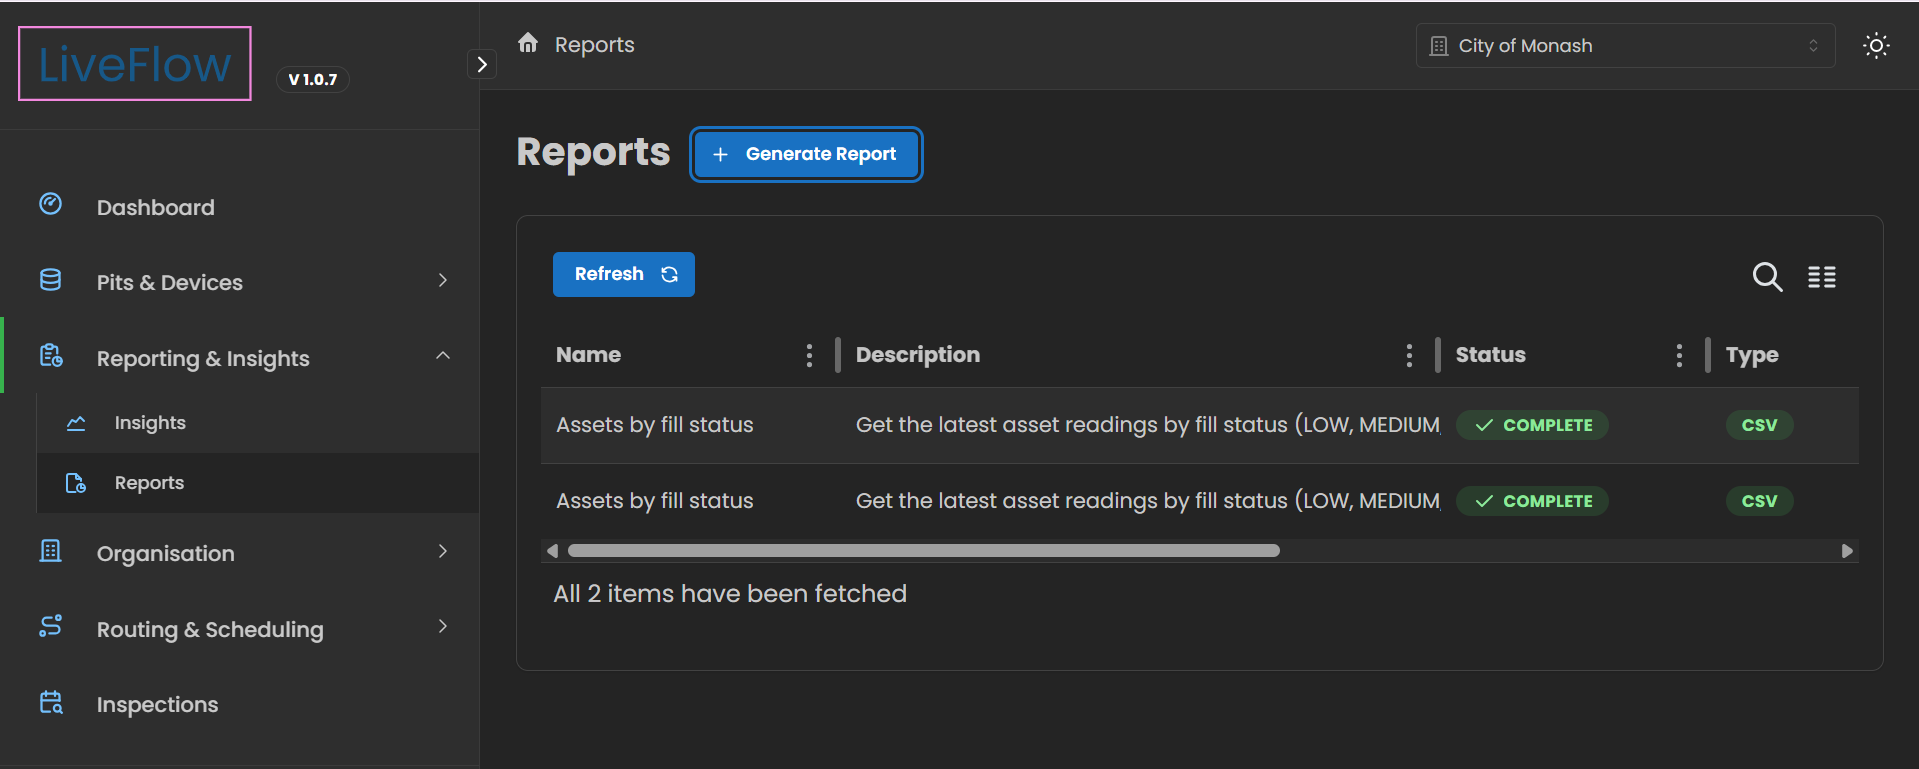
- Pre-Built Reports – Access ready-made templates for asset capacity, inspections, or alert history.
- Custom Reports – Build reports tailored to your needs by selecting specific assets, or metrics.
- Export Options – Download reports in CSV format for sharing with stakeholders or offline analysis.
- Audit Trail – Use reports for compliance, planning, and accountability.