Dashboard Homepage
This section explains how to navigate and manage all functions of the home dashboard of the Matter Platform.
Dashboard
Users are by default presented with the Home page shown below.
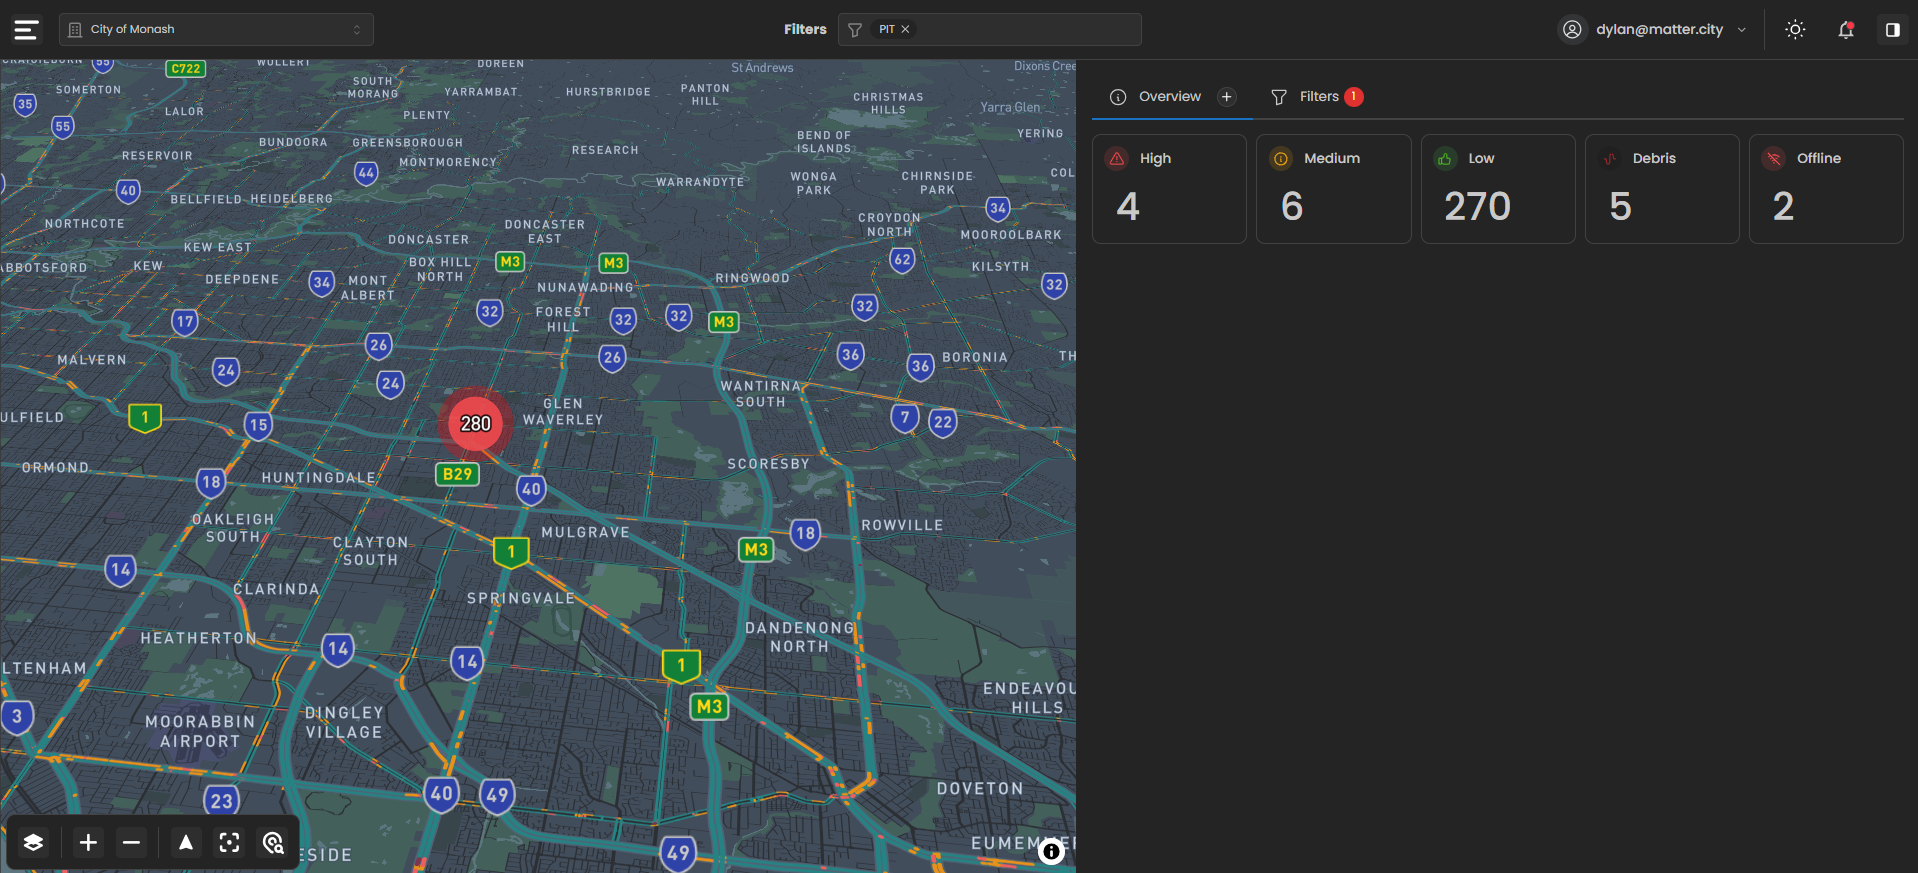
Map View of Assets
This is the home screen where you can see all assets for your organisation displayed on the map.
Clustered Devices
Assets are automatically clustered together by default to make the map easier to read.
Zoom & Real-Time Access
You can zoom in to view specific assets in real time for more detailed monitoring.
Dashboard Overview Widget
The Overview widget provides a high-level summary of asset conditions and environmental context for the current map view and applied filters. It is designed to give users an at-a-glance understanding of asset status, weather conditions, and operational priorities.
Customising the Overview
Next to the Overview label is a plus (+) icon, which allows users to select which metrics are displayed in the Overview widget.
Once all desired metrics are selected, the configuration is automatically saved and will persist for future sessions.
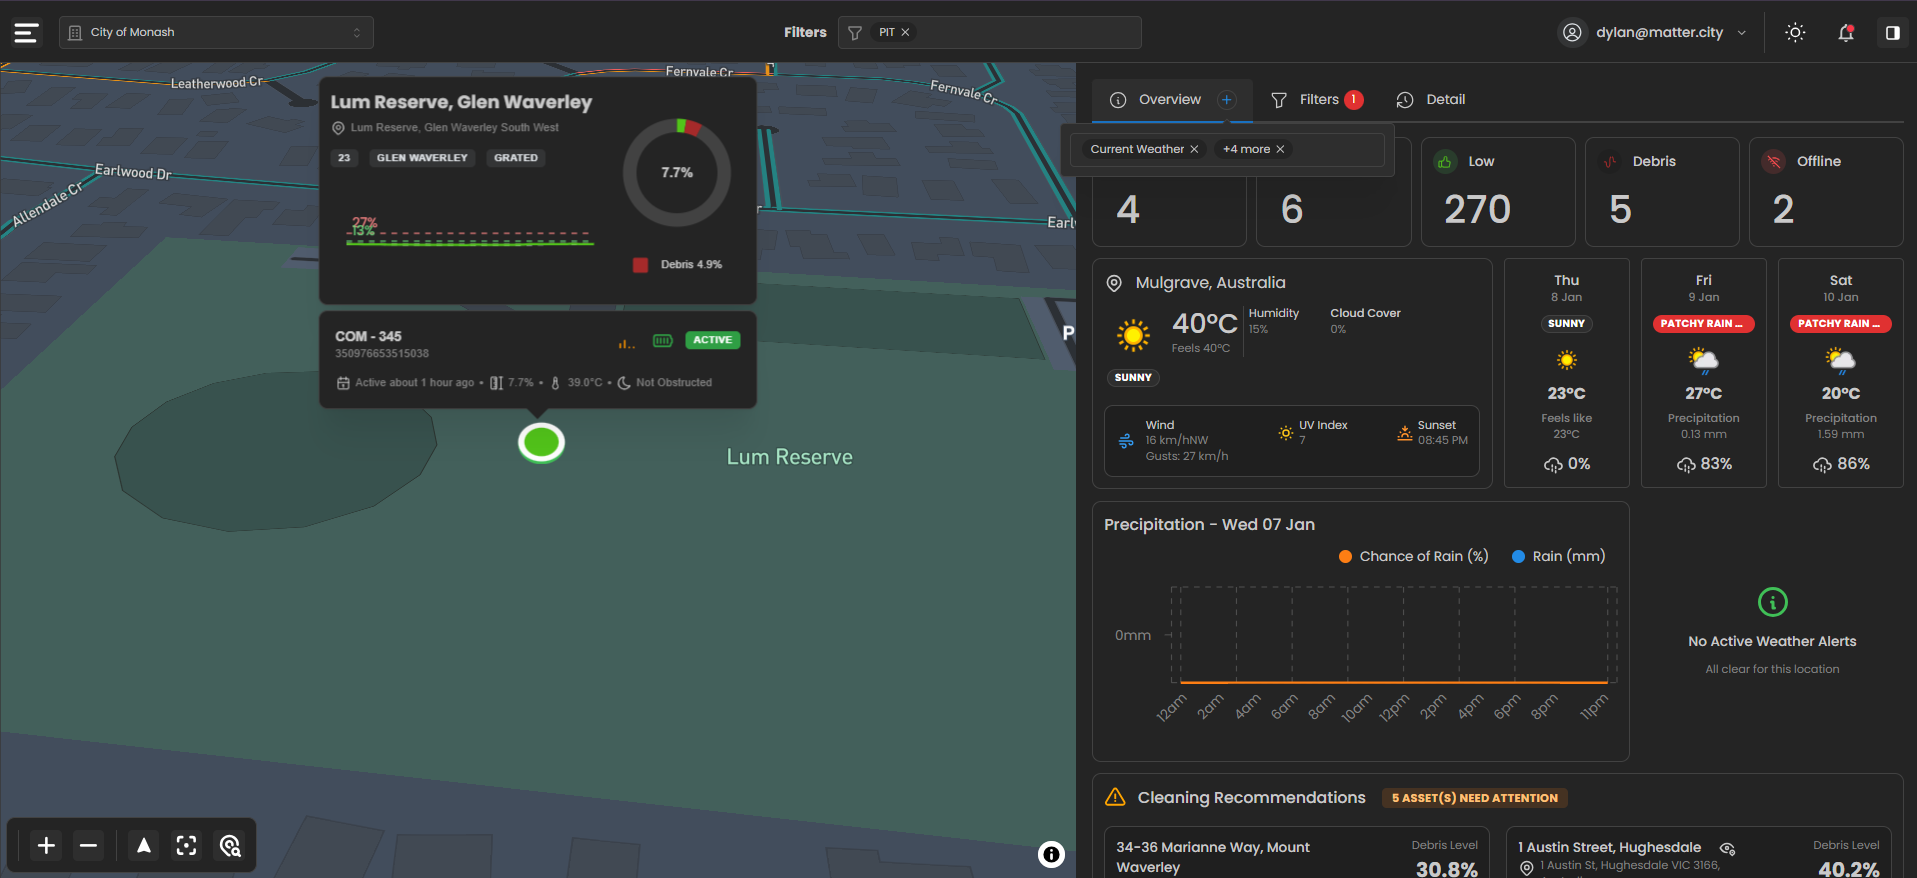
Overview Metrics
The Overview widget displays a combination of asset status metrics and contextual information.
Asset Status Summary
- Low – Number of assets currently reporting a low fill level
- Debris – Number of assets detecting debris
- Offline – Number of assets that are currently not reporting
These counts update dynamically based on the active filters and map view.
Current Weather
Current weather for the selected area (e.g. Mulgrave, Australia), including:
- Current temperature and “feels like” temperature
- Humidity
- Cloud cover
- Wind speed and gusts
- UV index
- Sunset time
- Current weather condition (e.g. Sunny)
Weather Forecast
A short-term weather forecast showing upcoming days, including:
- Expected conditions (e.g. Sunny, Patchy Rain)
- Daily high temperature
- Chance of precipitation
- Expected rainfall amount (mm)
Precipitation Timeline
An hourly precipitation chart displaying:
- Chance of rain (%)
- Rainfall (mm)
This helps users anticipate weather impacts on asset performance.
Weather Alerts
A weather alert section indicating whether there are any active weather warnings for the selected location.
If no alerts are present, the widget confirms that conditions are clear.
Cleaning Recommendations
At the bottom of the Overview widget, a Cleaning Recommendations section highlights assets that may require attention based on current conditions and sensor data.
- Displays the number of assets needing attention
- Lists affected assets along with debris level indicators
Clustered Devices
The clustering feature helps simplify the dashboard view by grouping nearby assets together.
- Automatic Clustering – Assets close to each other on the map are automatically combined into a single cluster
- Clean View – Reduces visual clutter when viewing large numbers of assets
- Expand on Zoom – As you zoom in, clusters break apart to reveal individual assets
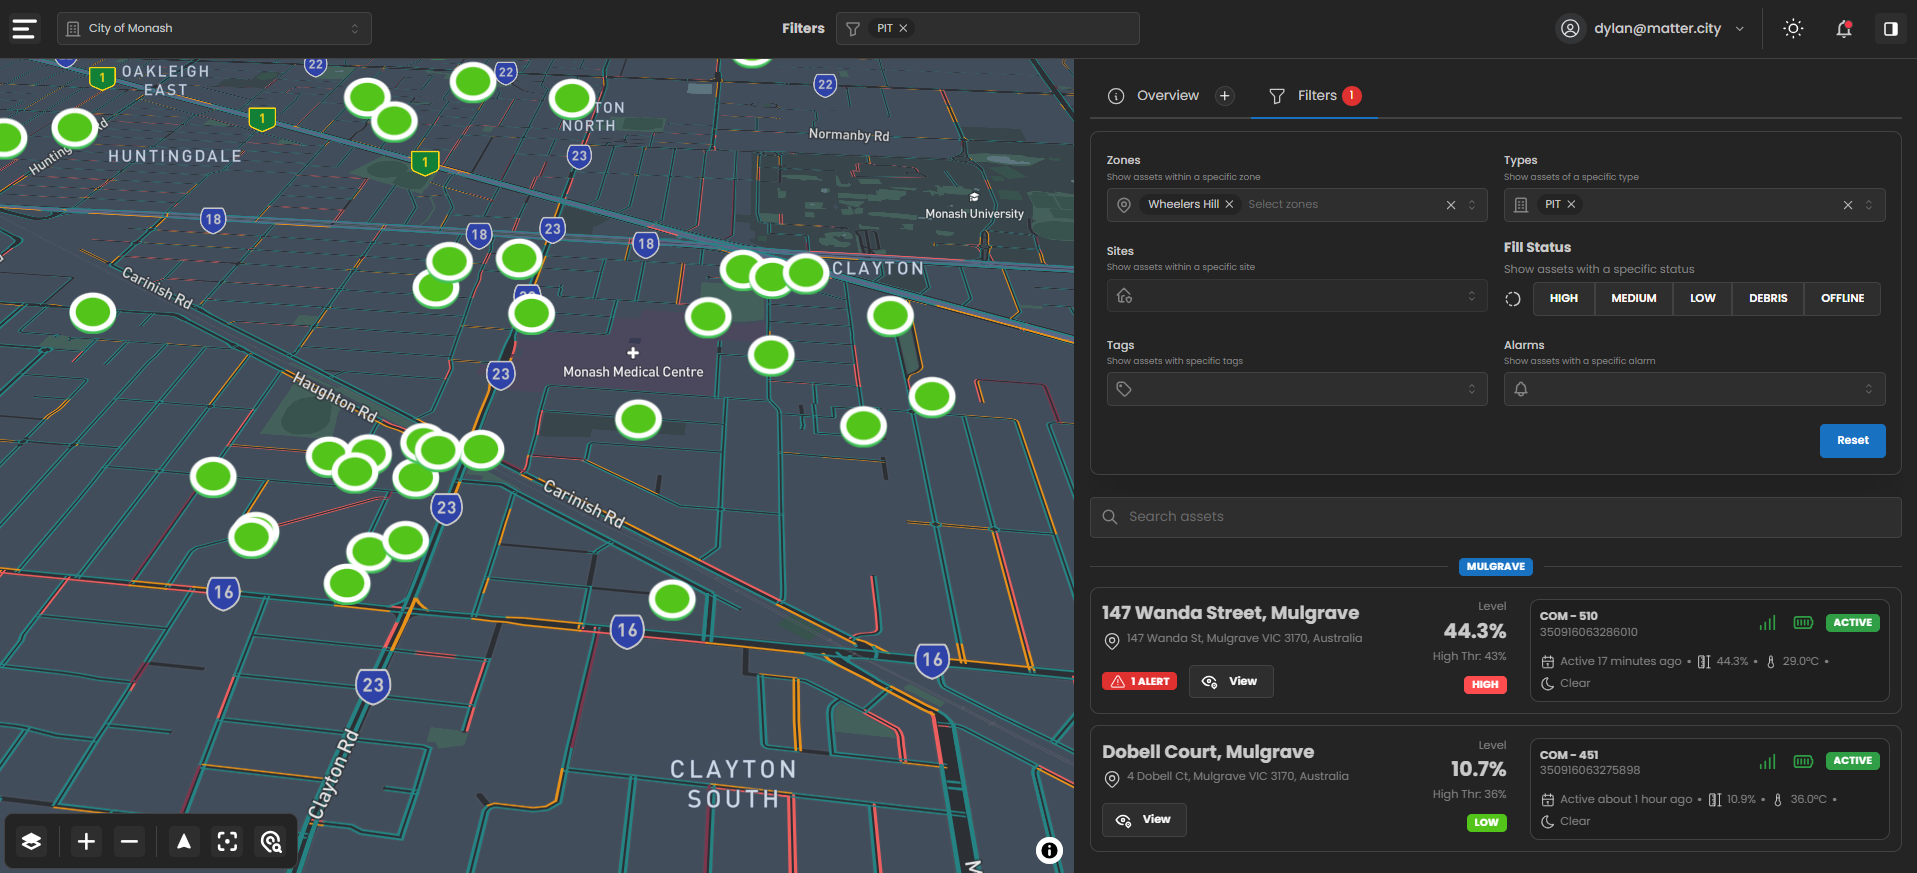
Filtering
The column on the right-hand side contains the tools and features used to interact with and manage your assets.
This section allows users to narrow down the list of assets displayed in the platform.
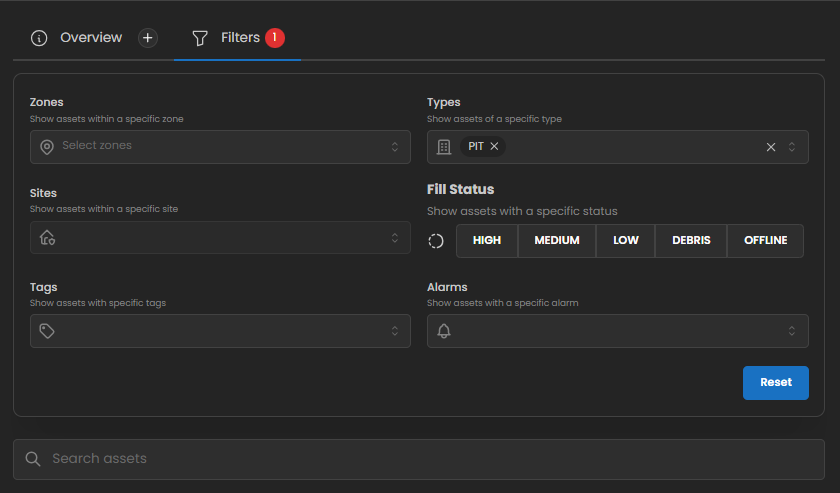
Available Filters
Zones
- Filters assets by geographic location
- Use the Select zones dropdown to show only assets within specific zones
Sites
- Filters assets by site
- Select a site to display only assets associated with that location
Tags
- Filters assets using custom tags
- Useful for grouping or identifying assets based on user-defined labels
Types
- Filters assets by asset type
- Example: selecting PIT shows only PIT-type assets
Fill Status
Filters assets based on their current fill level or condition:
- High
- Medium
- Low
- Debris
- Offline
Multiple statuses can be selected at once.
Alarms
- Filters assets that have active alarms
- Helps quickly identify assets requiring attention
Additional Controls
- Reset – Clears all applied filters and returns the asset list to its default state
- Search Assets – Search by asset name or identifier
Selecting an Asset
The asset list displays assets that match the current filters and search criteria. Each asset appears as a card containing key operational information.
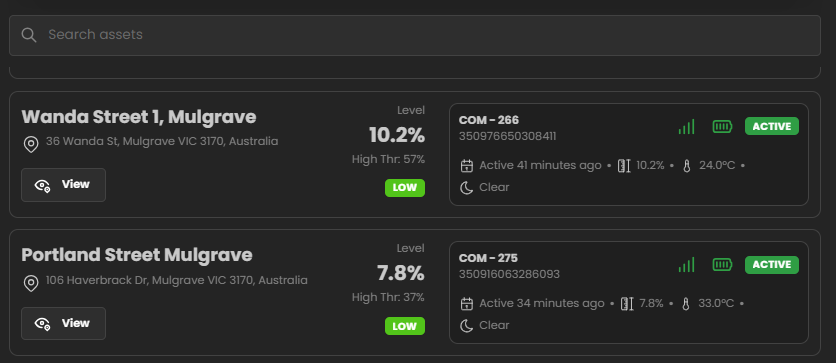
To select an asset:
- Locate the asset using filters or search
- Review key status indicators on the asset card
- Click View to open the asset’s detailed view
Asset Detail View (Map & Detail Panel)
When an asset is selected from the list or map, the platform opens the asset detail view, combining a map-based view with a detailed information panel.
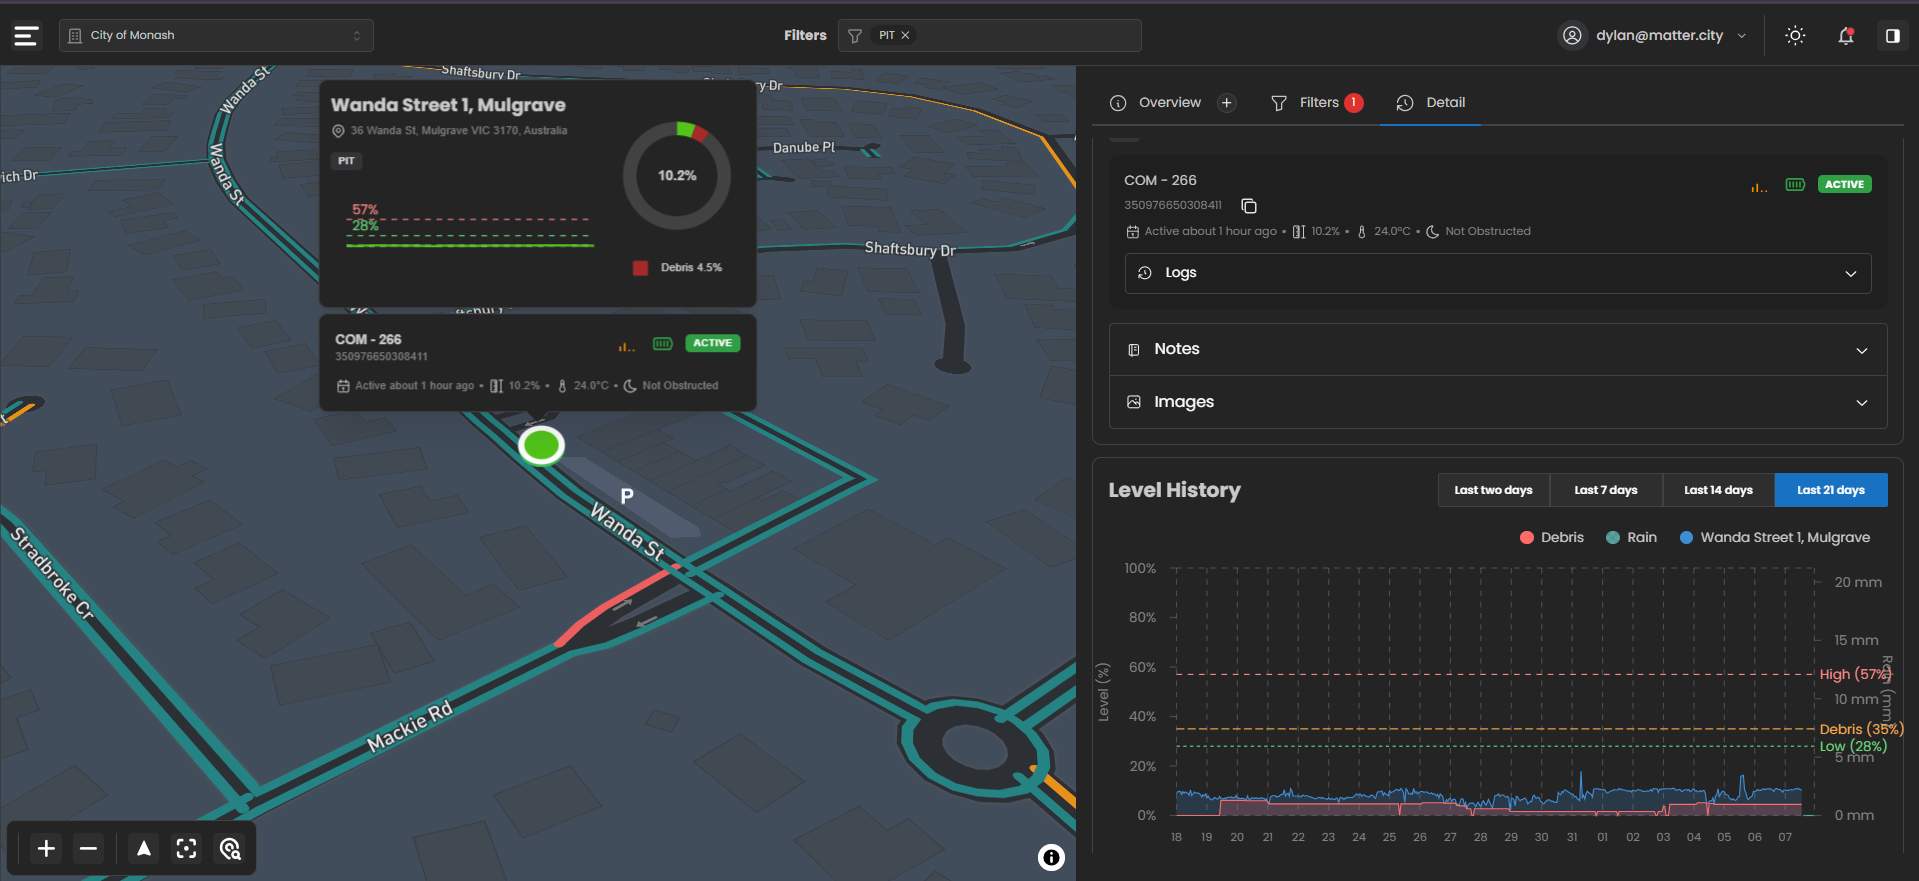
Map View
Asset Location
The selected asset is highlighted with a circular marker.
Asset Summary Popup
Displays:
- Asset name and address
- Asset type (e.g. PIT)
- Current fill level (circular gauge)
- Threshold indicators (Low, Debris, High)
- Debris percentage (if detected)
- Device ID and operational status (e.g. ACTIVE)
- Last activity time, temperature, and obstruction status
Network & Road Context
Surrounding roads and infrastructure provide geographic context.
Logs
Displays recent payloads and sensor updates for the asset.
Notes
Allows users to view or add operational notes.
Images
Displays inspection or camera images (if available).
Level History
Shows historical asset data over time.
Time ranges available:
- Last two days
- Last 7 days
- Last 14 days
- Last 21 days
Data displayed:
- Fill level trends
- Debris levels
- Rainfall (where available)
- Threshold lines for Low, Debris, and High
Capacity Alerts
The notifications system ensures you never miss critical events.
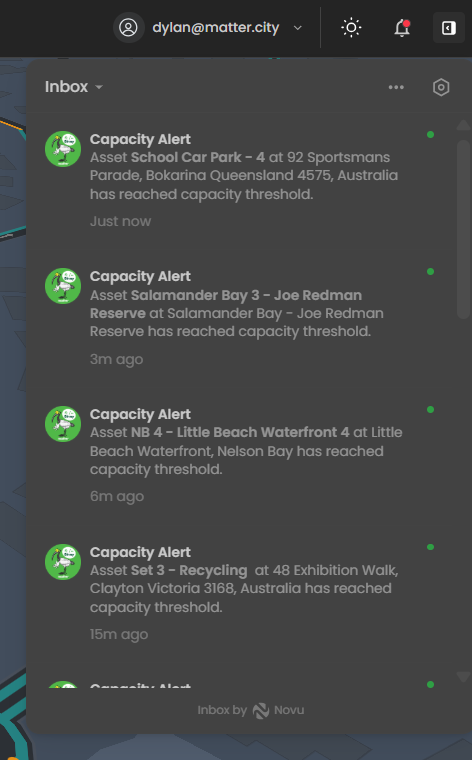
- Access Notifications – Click the bell icon (top right)
- Capacity Alerts – Triggered when assets reach capacity thresholds
- Quick Identification – Alerts show asset name, location, and time
- Action Required – Used to prioritise inspections or maintenance
Light and Dark Mode
Use the theme toggle to switch between light and dark modes.

- Toggle Themes – Switch between light and dark mode
- Visual Comfort – Light mode for bright environments, dark mode for low-light
- Automatic Adjustment – Map and UI update instantly
Creating Inspection Routes
Inspection routes allow you to plan and schedule site visits efficiently.
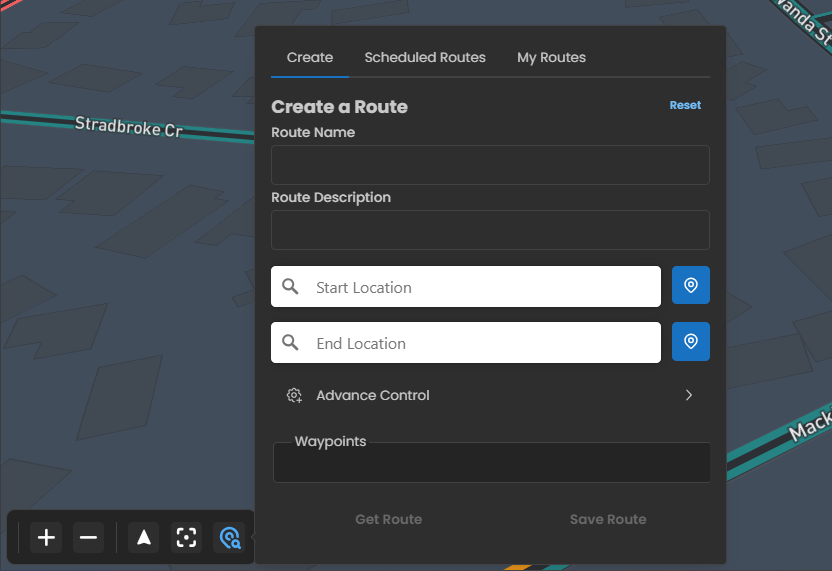
Steps to Create a Route
- Open the Route Panel and click Create
- Enter a route name and optional description
- Set start and end locations (search or map pin)
- (Optional) Assign route to a team or inspector
- Set start date and recurrence (daily, weekly, etc.)
- Save and schedule the route
The route will appear under Scheduled Routes or My Routes for tracking.